The update for Terra is available.
Customized grid charting tool is finished. Now you can draw this charting tool
clicking this button:

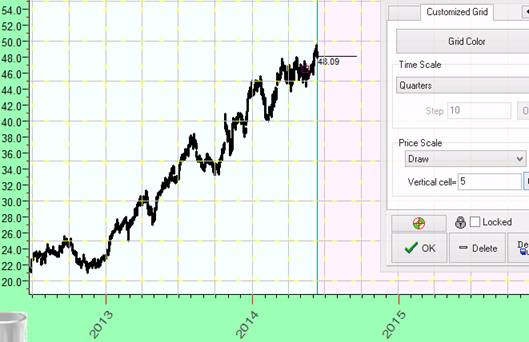
You can display any overlay grid, like this:
Y scale =$0.5Â X scale = weekly - vertical grid lines correspond Mondays:

or this: time scale= quaters
There is a new feature there: you can mark every 10th (or any other) price bar:
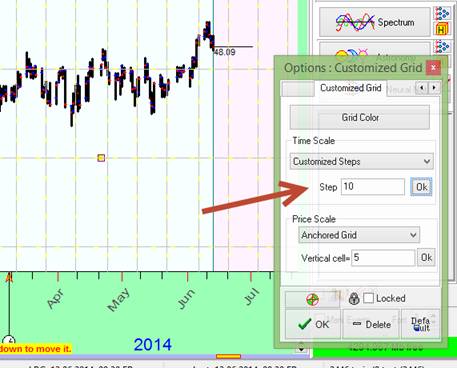
Here the program displays vertical grids for 1st price bar, 11 price bar, 21
price bars ....
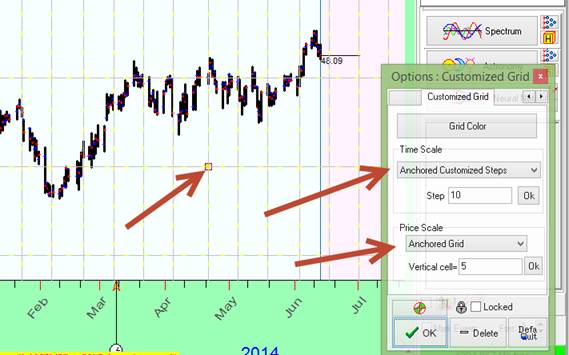
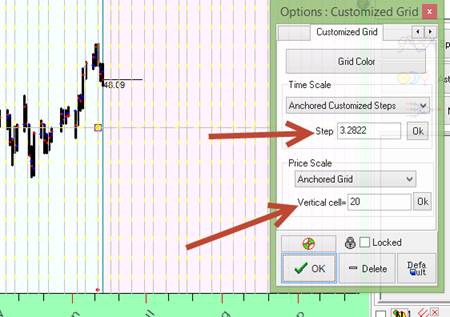
Using "Anchored..." options you can drag the whole grid:
Try to apply this charting tool together with quantum figures module.
Run this module (TI->Quantum Figures) and run optimization:
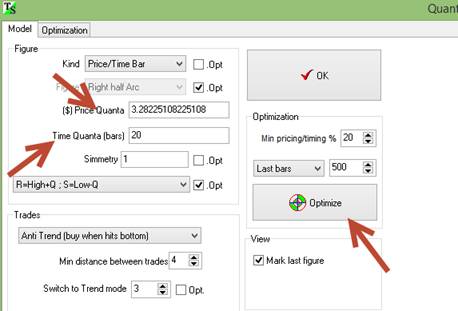
You see, it shows price quantum=$3.28225 time quantum=20 trading days
So we can display grid based on these quanta:
I recommend to play with these grids.
Best regards.
Sergey.